


History and background of Fishbone Diagram?
Professor Kaoru Ishikawa of Tokyo University, a well-known Japanese expert in quality management, devised the Fishbone Diagram. He used it for the first time to explain to a group of engineers at Kawasaki Steel Works in 1943 to show how a complex set of factors may be linked to help solve an issue. He created the fishbone diagram to assist staff in avoiding solutions that only address the symptoms of a much greater issue. Fishbone diagrams are one of the seven core quality tools used in the “analysis” phase of Six Sigma’s DMAIC (define, measure, analyze, improve, control) problem-solving strategy.
This is called Fishbone Diagram because the structure of this tool looks like a fishbone. This is also known by the name of Cause and effect diagrams, 4M Diagram, or Ishikawa diagrams.
What is Fishbone Diagram?

A fishbone diagram is a visual aid for sorting out the various causes of an issue. This tool is used to identify the potential or probable causes of an issue. A Fishbone diagram combines the process of brainstorming with a form of mind map template and is commonly used for root cause analysis. The problem or consequence is depicted by the “head” of the skeleton, which is commonly portrayed on the right. The “bones” stretch to the left to represent the various reasons. The ribs represent the analyses’ categories or classifications of causes, which branch out into causes and sub-causes. The branching is determined by the required levels for each classification.
As a test case technique for determining cause and effect, it should be effective. A fishbone diagram is commonly used to center a conversation around a problem in product development and troubleshooting processes. The facilitator supports the group in evaluating the various causes by importance and developing a hierarchy after the group has explored all possible explanations for an issue.
How to create Fishbone Diagram?
The fishbone diagram technique combines brainstorming and mind mapping to uncover an underlying problem’s cause and effect link. It forces you to think about practically every conceivable source of an issue rather than simply the most obvious ones. It not only assists you in determining the core cause of an issue but also identifies bottlenecks in your processes and locations where they aren’t operating. Let’s look at an example of how to make a fishbone diagram in four phases.
- Identify the Problem
The first step in making a fishbone diagram is to agree on and write down the specific problem you’re dealing with. Determine who is engaged, what the issue is, and when and where it occurs on your team. The fish’s head is made by writing out the problem as a statement and drawing a box around it. After that, a horizontal arrow with an arrow pointing to the head is painted across the page. This serves as the fish’s backbone.
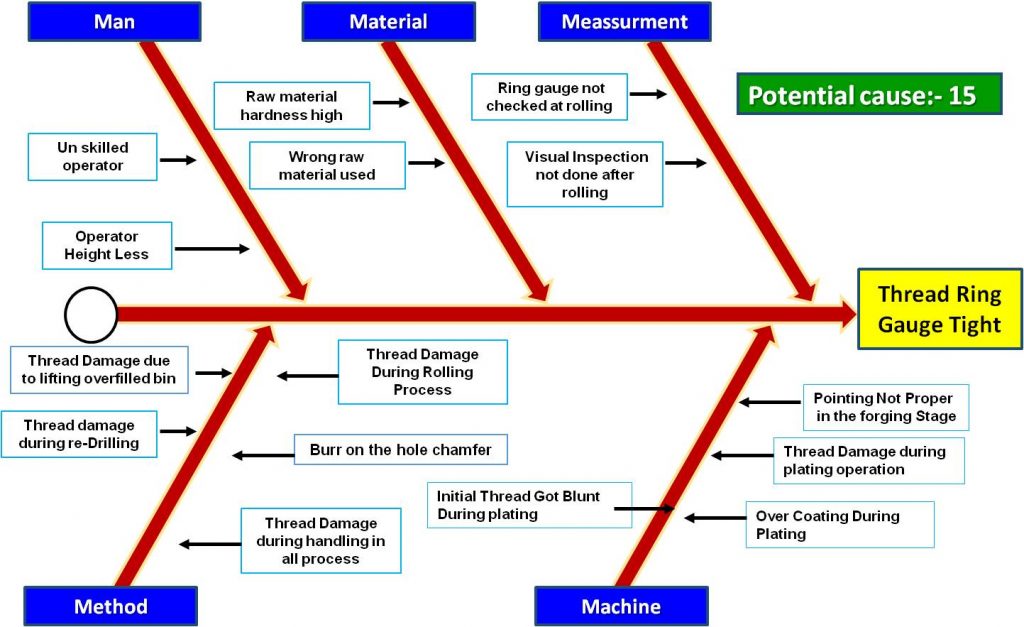
For the purpose of understanding, we have taken here a case study from an engineering company and the defect for which the team wants to create the fishbone diagram is “Thread Ring Gauge Tight” which can be called “Effect” over here.
In Six Sigma language, we call the effect “KPOV” i.e, Key Performance Output Variable or Output Variable simply.
- Brainstorm the major types of causes.
Step two is to decide how to categorize the sources of the current problem-the things that may be contributing to it. Equipment, materials, systems, external factors, people, and so on are examples of these. They usually center on the 4Ms we mentioned earlier in a manufacturing scenario. Draw a line off the spine of the fish for each factor as you identify it, then mark each line at the top. The team, in our case study, identifies and plots the following factors on the diagram:
- Man
- Machine
- Material
- Method
- Measurement
- Identify Possible Causes
Show these potential reasons as shorter lines emerging from the diagram’s “bones.” When a problem is huge or complex, it’s sometimes best to split it down into sub-problems. These should be drawn as lines branching off each cause line. Several inquiry approaches are utilized to keep the discourse focused, such as the 5 Whys or the 4Ps (Policies, Procedures, People, and Plants).
- Analyze the diagram
You should now have a complete fishbone diagram that shows all the potential causes of the problem statement. In our case study, we can see the team has discovered 15 probable causes.
You may now research the situation further and test to discover which of these potential causes is, in fact, contributing to the problem using methods like the 5 Whys, investigations, cause validation, and simulations.
The team in our case study after validation and why-why analysis has established that the most likely source of the problem is that the “Thread damage occurs during the rolling process”. So the team investigates further and establishes sources for Thread Damage during the rolling process and makes improvements in the process.
Then team initiates corrective action and monitors its effectiveness for some time to realize it is effective.
Benefits of Fishbone Diagram
Fishbone diagrams are beneficial because they present information clearly and understandably. The Fishbone Diagram has five primary advantages:
- Clearly and rationally display relationships: The fishbone diagram highlights the connections and linkages between the probable causes and outcomes (as shown in the figure above). The correlation may be grasped at a glance because it is logically organized.
- Display all causes at the same time: The problem could be caused by any of the causes or causal chains depicted on the fishbone graphic. The fishbone diagram depicts all probable reasons in a single diagram, which is useful for in-depth study. As a result, it can be used to explain the problem and solutions to stakeholders.
- Facilitate brainstorming: Because it captures all of the causes, hence fishbone diagram is a wonderful way to boost and structure brainstorming about the reasons for a specific result.
- Encourage problem-solving: Seeing the causes in a visual graph and looking into the fundamental cause may encourage your team to come up with solutions to challenges.
- Keep team Focused: As you explore what should be done to fix the problem or reach a common goal, the fishbone framework can help keep your team focused. It aids in the examination of all parties concerned. It also assures that no one is wasting their time chasing after problems that do not exist.
Conclusion

You must input as much information from the people participating in the analysis as possible to properly use the fishbone diagram. The Fishbone diagram and Flowcharts help to put the difficulties that led to the inadvertent acceleration recall disaster into perspective. The graphic will be accurate, effective, and valuable if the information is used correctly. People who use a fishbone diagram to find the probable causes and then to root causes will be able to do so.
The cause-and-effect relationship is visualized using a fishbone graphic. Despite its complexity, it emphasizes the concrete reasons that are more important than broad causes. You may break down large challenges into clearly understandable causes using a fishbone diagram. You can utilize the fishbone diagram effectively in root cause analysis if you follow the methods listed above. You may break down large challenges into clearly understandable causes using a fishbone diagram. You can utilize the fishbone diagram effectively in root cause analysis if you follow the methods listed above.


This is a great post! Look of your site is great.
Can you write something on Value Stream Mapping?
This is excellent post I have read so far on this topic. Covered basics in a simple way.. keep up the great work ?
Thanks for your feedback dear. Do check our other post as well.
Regards
[…] Diagram because the structure of this tool looks like a fishbone. This is also known by the name of Cause and effect diagrams, 4M Diagram, or Ishikawa […]
Thank you so much sir! The article is very useful. Clear and concise wording, easy to understand and implement.
This is very good article. The article has been written in a simple and iin detailed, so that student can grasp the content very easily. Appriciated your efforts sir.