


OEE (OVERALL EQUIPMENT EFFECTIVENESS) gauges the proportion of actual production time that is productive. There is a lot of room for improvement because many production lines are just 60% productive.
WHAT IS OEE?
A “best practices” indicator called OEE (Overall Equipment Effectiveness) measures the proportion of production time that is actually productive. A production process that produces only high-quality parts as quickly as possible with minimal downtime has an OEE score of 100%.
1.OEE is helpful as a baseline and a benchmark:
2.OEE can be used as a benchmark to evaluate a production asset’s performance to industry norms, to comparable internal assets, or to outcomes for several shifts working on the same asset.
OEE can be used as a starting point to monitor advancements in waste reduction for a specific manufacturing asset over time.
OEE BENCHMARKS
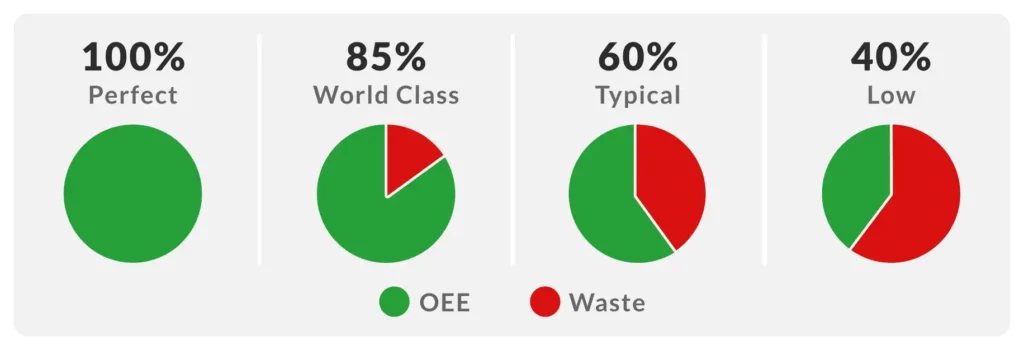
What OEE score would therefore be a “good” benchmark? What is an OEE score of a world-class?
1.A production process with a 100% OEE is ideal: only good parts are produced as quickly as possible without any downtime.
2.For makers of discrete products, 85% OEE is regarded as world class. It is an appropriate long-term objective for many businesses.
3.Although 60% OEE is quite normal for manufacturers of discrete goods, it shows there is still much opportunity for improvement.
SIMPLE OEE CALCULATIONS
How therefore is the OEE score determined?
OEE is the ratio of Fully Productive Time to Planned Production Time, put simply. In reality, OEE is determined as follows:
OEE = (Good Count × Ideal Cycle Time) / Planned Production Time
We’ll define a few words that are used in the OEE Formula.
Good Count:Pieces with a Good Count are those that were produced without any flaws.
Ideal Cycle Time: The theoretically quickest time to produce a single piece
Planned Production Time:the total time that the production asset is scheduled for production
Fully Productive Time: producing just quality work as quickly as possible without breaks.
PREFERRED OEE CALCULATION
- Availability Loss
- Performance Loss
- Quality Loss
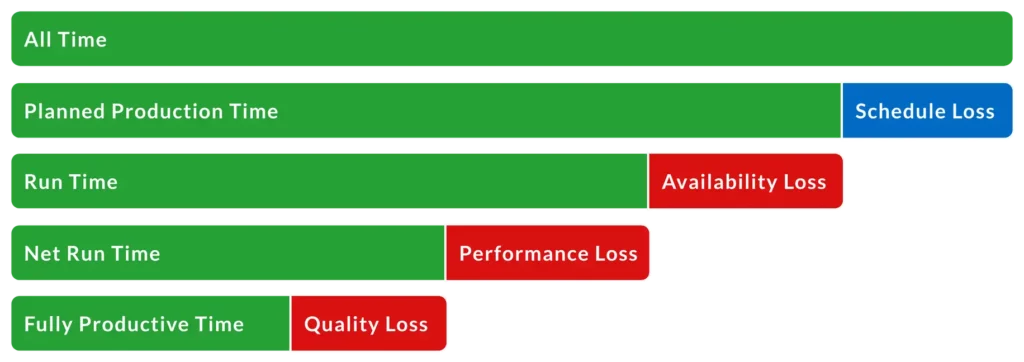
Availability Calculation
The term “availability” incorporates the concept of “availability loss,” which refers to any circumstance that prevents intended production for an extended period of time (typically several minutes or longer). Unplanned Stops (such equipment breakdowns and a lack of materials) and Planned Stops are both considered Availability Loss (such as changeover time).
The ratio of Run Time to Planned Production Time, where Run Time is simply Planned Production Time less Stop Time, is used to calculate availability:
Availability = Run Time / Planned Production Time
Where Run Time = Planned Production Time − Stop Time
Performance Calculation
Performance accounts for Performance Loss, which is made up of all elements that prevent a production asset from operating at its optimum possible speed when it is functioning (including Slow Cycles and Small Stops).
Net Run Time to Run Time is used to calculate performance. In actuality, it is computed as follows:
Performance = (Ideal Cycle Time × Total Count) / Run Time
The quickest time that can theoretically be used to produce one piece is called the ideal cycle time. Therefore, when it is multiplied by Complete Count, the result is Net Run Time, which is the theoretically quickest amount of time that the total number of pieces may be manufactured.
Here is an easy Performance calculation example:
| Item | Value | Explanation |
|---|---|---|
| Ideal Cycle Time | 1 minute | Theoretical fastest time to produce this part. |
| Total Count | 300 | Total quantity of pieces manufactured during this shift. |
| Run Time | 330 minutes | Run time of this shift (planned production time less stop time). |
| Performance | 90.9% | (Ideal Cycle Time × Total Count) / Run Time = (1 × 300) / 330 |
Quality Calculation
Quality includes Quality Loss, which subtracts manufactured items that don’t meet quality requirements, including later-reworked items.
Fully Productive Time (only Good Count manufactured as quickly as possible with no Stop Time) divided by Net Run Time is used to calculate quality (fastest possible time for Total Count). In actuality, it is computed as follows:
Quality = Good Count / Total Count
OEE Calculation
OEE calculates the total losses (Stop Time Loss, Speed Loss, and Quality Loss) to produce a measurement of manufacturing time that is actually productive.
The ratio of Fully Productive Time to Planned Production Time is used to compute OEE. In actuality, it is computed as follows:
OEE = Availability × Performance × Quality
The following is the outcome if the equations for availability, performance, and quality are substituted in the previous equation and then simplified:
OEE = (Good Count × Ideal Cycle Time) / Planned Production Time
The “easiest” OEE computation previously mentioned is this one. With any thought, it becomes clear that adding Good Count to Ideal Cycle Time yields Fully Productive Time (manufacturing only good parts, as fast as possible, with no stop time).
Perfect Production
It was formerly said that manufacturing only good parts as quickly as possible with no stop time would result in an OEE score of 100%. Let’s connect this idea of ideal production to the OEE calculation:
A 100% Quality Score is achieved by using only high-quality components.
As soon as feasible equals a Performance rating of 100 percent.
A score of 100% for availability means there is no stop time.
A fantastic technique to master the OEE computation is to work through examples from real-world situations. Visit the following website : https://courses.qualityhubindia.com/s/store for free spreadsheets, worked examples, and other resources
PLANT FLOOR METRICS
OEE is a great tool for managers, but for plant floor employees it can be a bit abstract. Plant floor employees will perform best when they are given goals that are real-time, easily interpreted and highly motivational. A good example of an effective set of plant floor metrics is TAED:
- Target: a real-time production target driven by the planned rate of production
- Actual: the actual production count
- Efficiency: the ratio of Target to Actual; how far ahead or behind production is running in terms of a percentage
- Downtime: accumulated unplanned stop time for the shift updated in real-time; this keeps a strong focus on a key actionable improvement area
Quality HUB India offered Online Courses on ‘Related subject“
5S Expert,Kaizan Expert Certification
TQM Total Quality Managemen,TPM Total Productive Management
You can read other relevant articles from Quality HUB India
QUALITY FUNCTION DEPLOYMENT (QFD)
Cost Reduction Technique: Cut Costs and Maximise Profi
Related Articles:
Top 10 Lean Six Sigma Green Belt Certification Institute India 2022
05 Must-Know Six Sigma Implementation Roadblocks and solutions